
You’re a SaaS founder, an executive, an investor. You’ve seen the dashboards, the spreadsheets, the endless parade of numbers. Monthly Recurring Revenue (MRR), Customer Acquisition Cost (CAC), Churn Rate – they fly at you faster than Neo dodging bullets in The Matrix. And if you’re like most, this deluge of data often leads to one thing: SaaS metric confusion. You’re tracking everything, yet you feel like you’re truly understanding nothing. It’s a common pain point: the sheer volume of metrics without clear guidance on their interrelationships or actionable insights. You’re likely experiencing the difficulty tracking KPIs and the frustration of poor SaaS performance measurement because you’re looking at isolated data points, not a strategic ecosystem.
This isn’t just about crunching numbers; it’s about translating those numbers into a strategic playbook for sustainable growth and profitability. This guide isn’t another listicle of definitions. We’re going Beyond the Numbers: Unlocking Strategic Growth and Profitability with a Holistic SaaS Metrics Framework. Consider this your definitive guide to measuring, interpreting, and actioning key performance indicators, from startup to enterprise. We’ll equip you with the tools to move beyond mere tracking to truly understand the interconnectedness of your business, ensuring every decision you make is data-driven and impactful.

Foundational SaaS Metrics: Your Essential Toolkit for Business Health
Before we climb the mountain of strategic insight, we must first master the base camp: the foundational SaaS metrics. These are your essential toolkit, the vital signs of your business. Understanding what these SaaS KPIs are and how to calculate them is non-negotiable. Without this bedrock, any attempt at advanced analysis is akin to building a skyscraper on quicksand. We’re not just defining; we’re providing the practical “how-to” for calculating SaaS key performance indicators that are truly the most important SaaS metrics for assessing overall business performance and profitability. Remember, while some financial reporting adheres to Understanding US Accounting Standards (GAAP), SaaS metrics often delve deeper into operational specifics. As NetSuite emphasizes, these metrics provide crucial insights into both financial and operational health.
Core Revenue & Retention Metrics: Tracking Your Financial Pulse
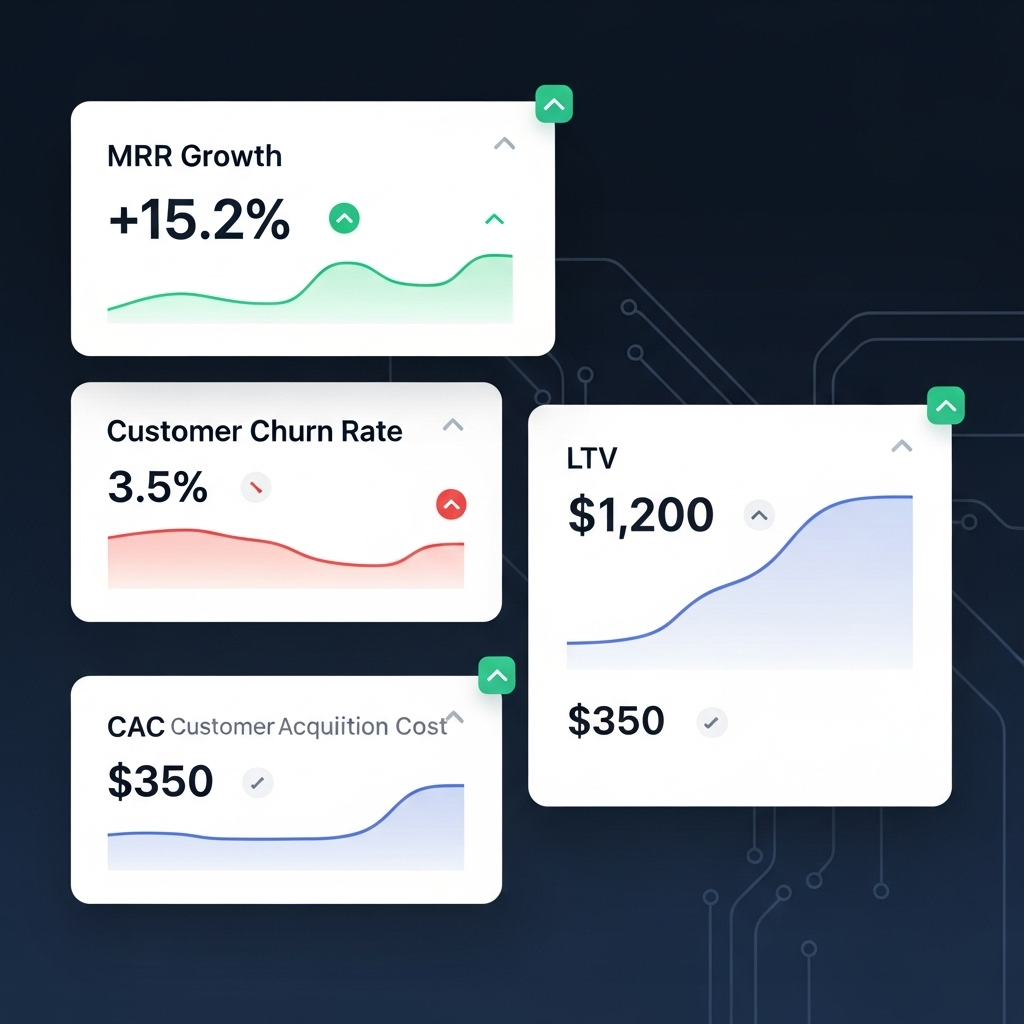
These metrics are the lifeblood of any SaaS business. They tell you if you’re growing, shrinking, or holding steady.
- Monthly Recurring Revenue (MRR) & Annual Recurring Revenue (ARR): MRR is the predictable revenue your business expects to receive every month. ARR is simply MRR multiplied by 12, providing an annualized view.
- Calculation: MRR = (Average Revenue Per User) x (Total Number of Monthly Users). ARR = MRR x 12.
- Significance: These are the ultimate indicators of your revenue stream’s health and growth velocity. They answer the fundamental question: “How much predictable money is coming in?”
- Customer Churn Rate: The percentage of customers who cancel or don’t renew their subscriptions over a given period.
- Calculation: (Number of Churned Customers in a Period / Total Customers at the Beginning of the Period) x 100.
- Significance: A high customer churn rate is a flashing red light. It indicates problems with product-market fit, customer success, or competitive pressures.
- Revenue Churn Rate: The percentage of recurring revenue lost from existing customers in a given period, including downgrades and cancellations.
- Calculation: (Lost MRR from Churn & Downgrades / MRR at the Beginning of the Period) x 100.
- Significance: This is often more critical than customer churn because it accounts for the value of the lost customers. A large enterprise client churning impacts revenue far more than a small business.
- Net Dollar Retention (NDR) / Net Revenue Retention (NRR): This “holy grail” metric, often lauded by investors, measures the percentage of recurring revenue retained from an existing customer cohort over a period, including upgrades, downgrades, and churn.
- Calculation: ((Starting MRR + Expansion MRR – Downgrade MRR – Churn MRR) / Starting MRR) x 100.
- Significance: An NDR above 100% means your existing customers are growing their spend with you faster than you’re losing revenue from churn and downgrades. This indicates strong product value, successful upsell/cross-sell motions, and a highly resilient business model.
- Gross Revenue Retention (GRR): Similar to NDR but excludes expansion revenue. It focuses purely on how much revenue you retain from your existing customer base without considering new upsells.
- Calculation: ((Starting MRR – Downgrade MRR – Churn MRR) / Starting MRR) x 100.
- Significance: GRR tells you how “sticky” your core product is. While NDR shows growth from existing customers, GRR reveals your baseline retention health. A GRR below 80-90% can be a serious concern, even if NDR looks healthy due to aggressive upsells.
Tracking these metrics is paramount for assessing the health and growth of a SaaS business. They provide a clear, quantifiable picture of your financial stability and growth potential.
Acquisition & Profitability Metrics: Fueling Sustainable Growth
Once you understand your revenue and retention, the next step is to analyze how efficiently you’re acquiring customers and how profitable those customers are.
- Customer Acquisition Cost (CAC): The average cost to acquire a new customer.
- Calculation: (Total Sales & Marketing Expenses / Number of New Customers Acquired) over a specific period.
- Significance: A critical measure of your sales and marketing efficiency. You can’t scale if your CAC is unsustainable.
- Customer Lifetime Value (LTV): The predicted total revenue that a customer will generate throughout their relationship with your business.
- Calculation: (Average Revenue Per User) x (Average Customer Lifespan). Or, for more accuracy: (Average Revenue Per Account) x (Gross Margin %) / (Customer Churn Rate).
- Significance: LTV tells you how much a customer is worth to your business over time. It’s the counter-balance to CAC.
- CAC Payback Period: The number of months it takes to earn back the cost of acquiring a customer.
- Calculation: CAC / (MRR per Customer x Gross Margin %).
- Significance: A shorter payback period means you recover your acquisition costs faster, allowing you to reinvest and grow more quickly. This is a key SaaS profitability metric.
- Gross Margin: The percentage of revenue left after deducting the cost of goods sold (COGS) directly attributable to delivering your SaaS service.
- Calculation: ((Total Revenue – COGS) / Total Revenue) x 100.
- Significance: This metric is crucial for understanding the inherent profitability of your service delivery. A healthy gross margin ensures you have enough left over to cover operational expenses and invest in growth.
These metrics are essential for assessing business performance and profitability, guiding your sales and marketing efforts. As Databox emphasizes, tracking and optimizing these metrics is key to sustainable growth. Investors like Updata Partners often distill this down to unit economics, focusing on metrics like Gross Margin Payback Period (GMPP) and Return on Customer Acquisition Cost (rCAC) as critical investor metrics, highlighting the importance of breaking even on customer acquisition and the long-term profitability of each customer.
Mastering these foundational metrics is akin to understanding your body’s vital signs; without this core knowledge, strategic decisions are made in the dark, risking the very health and sustainability of your SaaS venture.
The SaaS Metrics Ecosystem: Unlocking Interconnectedness for Strategic Growth
If Rocky Balboa was a content marketer, his montage wouldn’t include punching meat, one-handed pushups, and running up the 72 steps of the Philadelphia Museum of Art. No, some Philly Soul would accompany him writing SQL queries, wrangling multimillion-row CSV files, and working out how to rotate axis labels in D3. Because the truth is, data is data. And as a more nerdy version of Wet Wet Wet might have sung, “Data is all around.”
But raw data, isolated metrics, are just numbers on a screen. The real strategic power lies in understanding the SaaS metric ecosystem – how these individual data points interrelate and influence each other. This is where we move beyond the numbers to unlock true strategic growth. The pain point of metric confusion and isolated data dissolves when you see the whole picture. This holistic view is crucial for benchmarking SaaS business metrics effectively and truly assessing business performance and profitability.

Ben Murray, The SaaS CFO, articulates this beautifully with his Five Pillar SaaS Metrics Framework. This framework organizes key performance indicators into five distinct categories: Growth, Retention, Gross Margins, Financial Profile, and Sales/Marketing and Org Efficiency. It’s a powerful model for interconnectedness, demonstrating how a change in one area ripples through the entire business. Investors, as highlighted by the Growth Equity Interview Guide, don’t just look at individual metrics; they connect them to assess overall company health and potential.
Beyond Individual KPIs: Building a Holistic Framework
A single metric, no matter how compelling, rarely tells the whole story. It’s the ratios, the composite metrics, and the interplay between them that reveal the true strategic insights into your SaaS financial health.
- LTV:CAC Ratio: This ratio is the ultimate efficiency metric. It tells you how much value you get from a customer compared to how much it cost to acquire them.
- Calculation: Customer Lifetime Value / Customer Acquisition Cost.
- Significance: A healthy LTV:CAC ratio (often cited as 3:1 or higher for sustainable growth) indicates that your customer acquisition efforts are profitable and scalable. If it’s too low, you’re spending too much to acquire customers relative to the revenue they generate. If it’s too high, you might be under-investing in growth.
- Rule of 40: A quick health check for SaaS companies, suggesting that a company’s combined growth rate and EBITDA margin should equal or exceed 40%.
- Calculation: Revenue Growth Rate (%) + EBITDA Margin (%).
- Significance: This composite metric balances growth with profitability. A company growing at 30% with a 10% EBITDA margin hits the Rule of 40. So does a company growing at 10% with a 30% EBITDA margin. It’s a powerful indicator of a healthy, sustainable business model, often used by investors. The strategic implications of metrics like the LTV:CAC ratio and the Rule of 40 are paramount, as they directly influence investor confidence and valuation. Updata Partners, for instance, emphasizes unit economics and cohort-based analysis, which are deeply embedded in these composite metrics.
- SaaS Magic Number: Measures the efficiency of your sales and marketing spend in generating new recurring revenue.
- Calculation: ((Current Quarter ARR – Previous Quarter ARR) x 4) / Previous Quarter Sales & Marketing Spend.
- Significance: A Magic Number above 1.0 generally indicates efficient growth, while below 0.75 suggests inefficiency. It’s a quick way to gauge if your go-to-market engine is firing on all cylinders.
- Burn Multiple: A measure of how much capital a company burns to generate one dollar of new ARR.
- Calculation: Net Burn / Net New ARR.
- Significance: A lower burn multiple (e.g., below 1.0) is better, indicating capital efficiency. A high burn multiple (e.g., above 2.0) suggests you’re spending a lot to grow, which might be acceptable in hyper-growth phases but unsustainable long-term.
Successful SaaS businesses, regardless of their growth rates, industries, or size, consistently leverage these combined metrics to make informed decisions. They understand that these aren’t just numbers; they’re strategic levers.
Evolving Metric Priorities Across Growth Stages
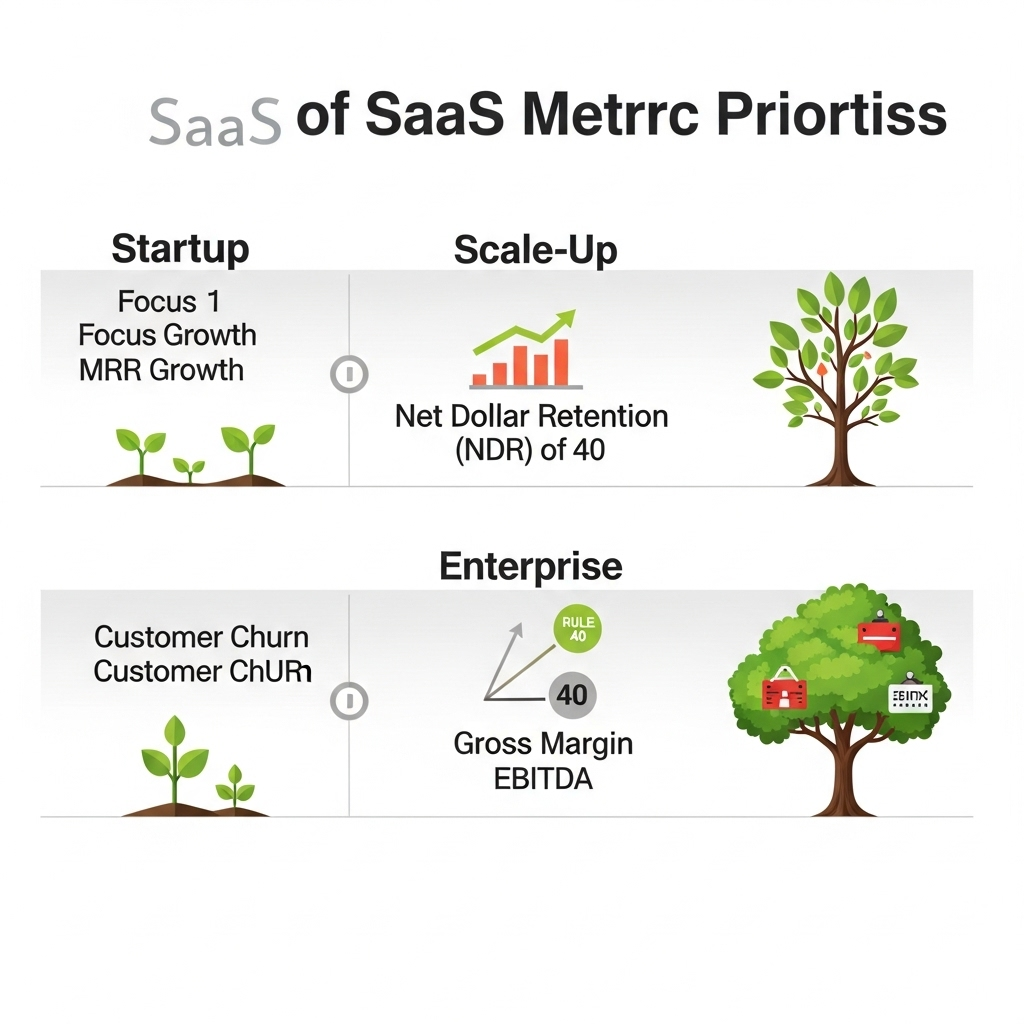
The metrics that matter most to a fledgling startup are not necessarily the same ones that dominate the boardroom of a publicly traded enterprise. Your SaaS growth stages metrics need to evolve with you. This addresses a critical content gap often overlooked: how metric priorities shift as a SaaS company matures.
- Startup Stage (Seed to Series A):
- Focus: Product-market fit, initial customer acquisition, and proving unit economics.
- Key Metrics: MRR (and its growth rate), Customer Churn Rate (to ensure retention), CAC, and initial LTV:CAC ratio. The goal is to show you can acquire customers and keep them, and that each customer is eventually profitable.
- Why: You’re proving your concept. Investors want to see that you can build a product people want and acquire them efficiently.
- Scale-Up Stage (Series B to C/D):
- Focus: Rapid growth, market expansion, optimizing go-to-market.
- Key Metrics: ARR growth, Net Dollar Retention (NDR) becomes paramount (showing existing customers grow), CAC Payback Period (efficiency of reinvestment), and the Rule of 40 (balancing growth and profitability).
- Why: You’ve proven the concept; now it’s about scaling efficiently. NDR above 100% is a powerful signal of healthy expansion.
- Enterprise Stage (Public or Large Private):
- Focus: Sustainable profitability, operational efficiency, market leadership, shareholder value.
- Key Metrics: Gross Margin, EBITDA, Free Cash Flow, Sales & Marketing efficiency metrics (e.g., SaaS Magic Number), and continued focus on NDR and Rule of 40.
- Why: Growth stabilizes, and the focus shifts to maximizing profitability and demonstrating operational excellence.
As Ben Murray (The SaaS CFO) advises, adapting your SaaS Metrics Framework to your company’s stage is not just smart, it’s essential for confident scaling. This understanding of evolving metric priorities ensures you’re always measuring what truly matters for your current strategic objectives.
Recognizing the intricate dance between your SaaS metrics transforms raw data into a strategic compass; this holistic understanding empowers leaders to navigate market complexities and steer their company towards sustained, profitable expansion, rather than simply reacting to isolated numbers.
Actioning Your SaaS Metrics: Driving Decisions and Sustainable Profitability
The true value of data isn’t in its collection, but in its application. This is where you move from merely tracking to actively improving SaaS metrics and engaging in SaaS strategic decision-making. This section provides practical, actionable strategies for translating metric data into informed business decisions, focusing on how to leverage KPIs to optimize various functions and achieve real-world outcomes.
One of the most egregious forms of data misuse is to collect it without a clear path to action. If you’re struggling with difficulty tracking KPIs or poor SaaS performance measurement, it’s likely because you haven’t built the bridge from insight to execution. As Databox consistently demonstrates, the power of analytics lies in its ability to inform and optimize.
Consider the case of a mid-sized SaaS company struggling with high CAC. By meticulously tracking their SaaS KPI calculation for each marketing channel, they discovered that while paid social brought in many leads, the LTV of those customers was significantly lower than those acquired through content marketing. This insight led them to reallocate budget, reducing their overall CAC and improving their LTV:CAC ratio, directly impacting their profitability. This is a real-world example of how specific metrics were used to make key business decisions and effect changes. Investors and entrepreneurs alike use metrics not just to evaluate, but to drive strategic outcomes.
Leveraging Metrics for Optimized Acquisition & Retention Strategies
Your acquisition and retention metrics are not just historical records; they are predictive indicators and levers for future growth.
- Optimize SaaS Acquisition:
- CAC & LTV:CAC: Analyze these metrics by channel, campaign, and even sales rep. If your LTV:CAC is too low for a specific channel, re-evaluate your spend or optimize your conversion funnel. If it’s exceptionally high, double down.
- Conversion Rates: Track lead-to-MQL, MQL-to-SQL, and SQL-to-customer conversion rates. Identify bottlenecks. Is your marketing generating low-quality leads, or is your sales team struggling to close?
- Actionable Tip: Implement A/B testing on landing pages and ad copy to lower CAC. Refine your ideal customer profile (ICP) to attract customers with higher LTV.
- Improve SaaS Retention:
- Customer & Revenue Churn: Segment your churn by customer size, industry, feature usage, and onboarding experience. Are small businesses churning more? Is a specific feature causing frustration?
- NDR & GRR: Use these to identify opportunities for expansion. If NDR is low, focus on customer success and identifying upsell/cross-sell opportunities. If GRR is low, your core product might have stickiness issues.
- Actionable Tip: Proactive customer success outreach for at-risk accounts. Implement in-app tutorials and onboarding flows that drive feature adoption. Offer tiered pricing to encourage upgrades.
Successful SaaS businesses consistently use these SaaS sales metrics and SaaS marketing metrics to optimize their strategies. The “Tips for improving SaaS metrics” often revolve around this iterative process of measuring, analyzing, and then acting on the insights to refine campaigns and customer success initiatives.
Translating Data into Financial Health & Operational Excellence
Beyond the customer-facing metrics, your financial and operational KPIs are crucial for maintaining SaaS financial health and driving operational efficiency KPIs.
- Gross Margin & COGS: Regularly review your Cost of Goods Sold. Are there ways to optimize your infrastructure costs (e.g., cloud hosting, third-party APIs)? Can you streamline your customer support processes? Improving gross margins directly impacts your profitability.
- Operational Efficiency: Metrics like “Revenue per Employee” or “Support Tickets per Customer” can highlight areas for operational improvement. Are you scaling your team efficiently with your revenue growth?
- Pricing Strategy: Use LTV and CAC data to inform your pricing. Are you leaving money on the table? Could a higher price point still yield a healthy LTV:CAC, increasing your overall profitability?
- Resource Allocation: Your metrics should dictate where you invest. If your sales team is highly efficient, perhaps more investment there will yield greater returns. If R&D is lagging, impacting feature adoption and churn, that’s where resources need to flow. This is how you make data-driven SaaS decisions.
- Actionable Tip: Implement automation for repetitive tasks to reduce operational overhead. Regularly review your tech stack for redundancies or underutilized tools.
Integrating insights from The SaaS CFO (Ben Murray) on using financial pillars for confident scaling underscores the importance of these internal metrics. They don’t just tell you what happened; they tell you why it happened and what to do next. This is the essence of translating metric data into actionable insights and real-world business outcomes, fostering a robust Technology and the Innovation Economy. For broader economic context, you can even look at OECD Science and Technology Indicators to benchmark your operational efficiency against industry best practices.
The true power of SaaS metrics lies not in their calculation, but in their application; by actively translating these insights into strategic adjustments, businesses can move beyond mere tracking to proactively engineer their own success, ensuring sustainable growth and robust profitability.
Key Takeaways
- SaaS metrics are crucial for assessing business health, growth, retention, and profitability.
- A holistic framework, not isolated metrics, reveals the true strategic insights for SaaS companies.
- Key metrics like MRR, Churn, LTV, and CAC are foundational for understanding performance.
- Metric priorities evolve significantly as a SaaS company grows from startup to enterprise.
- Translating metric data into actionable strategies is essential for driving sustainable growth and profitability.
- Leveraging insights from investors and financial experts provides a critical lens for metric interpretation.
Conclusion
The journey through the intricate world of SaaS metrics can feel like navigating a dense jungle. But with the right compass – a holistic SaaS metrics framework – you can transform confusion into clarity, and raw data into strategic advantage. We’ve moved Beyond the Numbers, exploring not just what to measure, but how to interpret their interconnectedness and, most importantly, how to action those insights to drive sustainable growth and profitability.
Remember, the most successful SaaS companies aren’t just tracking; they’re acting. They understand that continuous monitoring and adaptation of metrics are crucial for long-term success, allowing them to proactively engineer their future. Don’t let your data be a mere historical record; let it be your strategic North Star.
Ready to transform your SaaS business with data-driven insights? Contact us today for a tailored consultation on optimizing your key performance indicators and building a robust metrics strategy.
Frequently Asked Questions
What are the most important SaaS metrics?
The most important SaaS metrics include Monthly Recurring Revenue (MRR), Annual Recurring Revenue (ARR), Customer Churn Rate, Revenue Churn Rate, Net Dollar Retention (NDR), Customer Acquisition Cost (CAC), Customer Lifetime Value (LTV), and the LTV:CAC ratio. Their importance can vary by business stage.
How do SaaS metrics help assess business performance and profitability?
SaaS metrics provide a quantifiable snapshot of a company’s health, growth trajectory, and efficiency. They help assess performance by revealing trends in customer acquisition, retention, revenue generation, and operational costs, directly impacting profitability analysis.
What is the difference between SaaS metrics and KPIs?
While often used interchangeably, ‘SaaS metrics’ refer to any data point you can measure (e.g., website traffic). ‘Key Performance Indicators’ (KPIs) are a subset of metrics specifically chosen to reflect the most critical aspects of your business performance against strategic goals. All KPIs are metrics, but not all metrics are KPIs.
How do financial metrics translate to SaaS businesses?
Traditional financial metrics are adapted for SaaS to account for recurring revenue models. For example, instead of one-time sales, SaaS focuses on MRR/ARR. Profitability is often viewed through Gross Margin, and investment efficiency through CAC Payback Period and LTV:CAC, reflecting the subscription nature.
What are tips for improving SaaS metrics?
Improving SaaS metrics involves a holistic approach: focus on reducing churn through enhanced customer success, optimize marketing channels to lower CAC, increase LTV through upselling/cross-selling, and streamline operations to improve gross margins. Regularly analyze data to identify bottlenecks and opportunities.
This article provides general information and is not financial or investment advice. Consult with a qualified professional for specific business or financial decisions.
References
- Ben Murray, The SaaS CFO. Scaling with Confidence: The Ultimate SaaS Metrics Playbook – The SaaS CFO.
- Databox. Metrics Every SaaS Company Should Track – Databox.
- Growth Equity Interview Guide. Top SaaS Metrics: What Investors & Entrepreneurs Need To Know – Growth Equity Interview Guide.
- NetSuite. SaaS Metrics – NetSuite.
- Updata Partners. SaaS Metrics Framework – Updata Partners.


