
If Rocky Balboa was a content marketer, his montage wouldn’t include punching meat, one-handed pushups, and running up the 72 steps of the Philadelphia Museum of Art. No, some Philly Soul would accompany him writing SQL queries, wrangling multimillion-row CSV files, and working out how to rotate axis labels in D3. Because in the world of SaaS, your true strength isn’t in your bicep curl, but in your data curl.
The sheer volume and complexity of SaaS metrics can feel like a foreboding mountain range. For many SaaS founders, CEOs, CFOs, and growth leaders, particularly those in bootstrapped or early-stage companies, the challenge isn’t just knowing what to track, but how to track it accurately, how to use it strategically, and how to benchmark it effectively. Are you grappling with confusing SaaS metrics? Do inaccurate KPI calculations leave you questioning your decisions? Are you suffering from poor SaaS performance tracking that obscures your path to growth?
You’re not alone. Many companies struggle to transform raw data into actionable intelligence, missing critical opportunities for sustainable growth and competitive advantage. This isn’t just about numbers; it’s about the very pulse of your business.
This isn’t just another listicle of definitions. This is The Definitive SaaS Metrics Playbook: your comprehensive guide to mastering the art and science of SaaS measurement. We’re going beyond the basics to provide you with flawless calculation methodologies, strategic application frameworks, advanced analytics techniques, and robust competitive benchmarking strategies. By the end of this guide, you won’t just understand your data; you’ll wield it as your most powerful weapon for unlocking sustainable growth and dominating your market.

Key Takeaways
- Accurate Calculation is Foundational: Precise formulas and data integrity are essential for core SaaS metrics like MRR, CAC, CLV, and NRR, avoiding common pitfalls that lead to flawed decisions.
- Metrics Drive Strategy: KPIs must be strategically chosen and applied based on your company’s growth stage (startup, growth, mature) to inform and optimize marketing, sales, and product efforts.
- Predictive Analytics Unlocks Growth: Moving beyond historical data, leveraging advanced SaaS analytics helps anticipate churn, identify hidden opportunities, and proactively guide business decisions.
- Benchmarking is Your Competitive Compass: Regularly comparing your KPIs against reliable industry benchmarks (e.g., from SaaS Capital, Baker Tilly) provides crucial context for performance and identifies areas for improvement.
- Overcome Complexity with Clarity: Demystifying confusing terms (e.g., bookings vs. billings, ARR vs. MRR) and establishing clear data governance are vital for effective metric management.
- Continuous Optimization is Key: SaaS metric mastery is an ongoing process involving regular review, adjustment, and the adoption of tools that automate tracking and reporting for sustained success.
- The SaaS Metrics Ecosystem: Beyond Basic Definitions to Strategic Understanding
- Flawless Calculation: Your Step-by-Step Guide to Essential SaaS KPIs
- Monthly Recurring Revenue (MRR) & Annual Recurring Revenue (ARR): The Lifeblood of SaaS
- Customer Acquisition Cost (CAC): Understanding Your Investment in Growth
- Customer Lifetime Value (CLV): Projecting Long-Term Customer Worth
- Net Revenue Retention (NRR) & Churn Rate: The True Indicators of Health
- Other Critical Operational & Financial Metrics (e.g., ASP, Rule of 40)
- Best Practices for Data Accuracy and Avoiding Calculation Pitfalls
- Strategic Application: Leveraging Metrics to Drive Growth & Profitability
- Predictive Power: Transforming SaaS Analytics into Actionable Insights
- Competitive Edge: Mastering SaaS Performance Benchmarking
- Overcoming Common Challenges in SaaS Metric Management
- Conclusion
- References
The SaaS Metrics Ecosystem: Beyond Basic Definitions to Strategic Understanding
In the dynamic world of Software as a Service, data isn’t just data. It’s the lifeblood, the compass, and the crystal ball that reveals your company’s true health and future trajectory. Without a deep, nuanced understanding of your SaaS metrics and SaaS KPIs, you’re flying blind. This section lays the groundwork, clarifying foundational concepts and emphasizing the strategic interdependencies that form a holistic, predictive framework for business health.
What are SaaS Metrics and KPIs? Clarifying the Core Concepts
Let’s cut through the jargon. SaaS metrics are quantifiable data points that track the performance of your SaaS business. They measure everything from customer acquisition to revenue generation and retention. SaaS KPIs (Key Performance Indicators) are a subset of these metrics – the most critical ones that directly align with your strategic business goals and indicate overall health. Think of it this way: all KPIs are metrics, but not all metrics are KPIs. As Investopedia highlights, KPIs are specifically chosen to assess performance against strategic objectives.
The distinction between a measure, a metric, and a KPI is crucial. A “measure” is a single data point (e.g., “50 new sign-ups”). A “metric” is a calculation derived from measures (e.g., “50 new sign-ups / 1,000 website visitors = 5% conversion rate”). A “KPI” is a metric that is key to your strategic goals, often with a target attached (e.g., “Achieve a 5% conversion rate to meet Q3 growth targets”). Spider Strategies emphasizes that KPIs must align with strategic goals to be truly effective.
This isn’t just about isolated numbers; it’s about understanding the SaaS metrics ecosystem. Every metric influences another. Your Customer Acquisition Cost (CAC) impacts your Customer Lifetime Value (CLV), which in turn affects your Net Revenue Retention (NRR). They are interconnected, forming a complex web that, when understood, paints a complete picture of your business. For instance, understanding Product-Led Growth Metrics Explained can provide another layer of insight into how product usage directly impacts retention and expansion.
Untangling Confusing SaaS Metrics: Bookings, Billings, and Revenue Demystified
One of the most common pain points for SaaS leaders is the sheer confusion surrounding similar-sounding terms. Let’s tackle the notorious trio: bookings, billings, and revenue.

- Bookings: This represents a customer’s contractual commitment to spend money. It’s the value of the signed contract. If a customer signs a 12-month contract for $1,000/month, you’ve secured $12,000 in bookings. This is a forward-looking metric, indicating future demand.
- Billings: These are the actual invoices sent to customers for services. They reflect when you collect cash. If that $12,000 contract is billed annually upfront, you’d have $12,000 in billings at the start. If it’s billed monthly, you’d have $1,000 in billings each month.
- Revenue: This is recognized over the period the service is delivered, according to accounting standards like ASC 606. For that $12,000 annual contract, you’d recognize $1,000 in revenue each month, regardless of when it was billed or booked.
As the Growth Equity Interview Guide explains, understanding these distinctions is crucial, especially with the complexities of ASC 606 revenue recognition. Similarly, the difference between Annual Recurring Revenue (ARR) and Monthly Recurring Revenue (MRR) often causes confusion.
- MRR: The total predictable recurring revenue your business expects to receive every month. It’s the sum of all active subscriptions’ monthly values.
- ARR: The total predictable recurring revenue your business expects to receive every year. It’s typically calculated as MRR x 12, but only for contracts that are annual or multi-year.
For entrepreneurs, For Entrepreneurs offers detailed definitions to clarify these and other confusing metrics like churn and renewal rates. Visualizing these concepts with flowcharts can further simplify complex accounting concepts, transforming confusion into clarity.
Why Accurate Metrics are Non-Negotiable for SaaS Success
You wouldn’t trust a pilot who guesses their altitude. Why would you run a SaaS business on guesswork? The importance of accurate KPI calculation cannot be overstated. Flawed data leads to flawed decisions, wasted resources, and missed opportunities. It’s the difference between scaling efficiently and spiraling into unprofitability.
When your KPIs are inaccurate, your entire strategic planning process is compromised. You might invest heavily in marketing channels with a seemingly low CAC, only to discover later that the calculation was missing crucial overheads. Or you might celebrate a high MRR, unaware that hidden churn is silently eroding your base. This is why we advocate for a “Precision Playbook” approach. As Maxio points out, accurate SaaS metrics are fundamental for business health and investor confidence. Without them, you’re not just tracking poorly; you’re actively misleading yourself.
Without a crystal-clear understanding of what each metric truly represents, SaaS leaders are navigating their growth journey blindfolded, making decisions based on faulty assumptions. Mastering these foundational concepts is the bedrock upon which all future strategic growth and reliable performance tracking will be built.
Flawless Calculation: Your Step-by-Step Guide to Essential SaaS KPIs
Now that we’ve demystified the terminology, it’s time to roll up our sleeves. This section is your “Precision Playbook” for how to calculate SaaS metrics with unwavering accuracy. We’ll provide precise formulas and step-by-step methodologies for the most critical SaaS KPIs, ensuring your data is not just present, but correct. As NetSuite and Maxio underscore, accurate calculations are paramount for understanding your business’s true financial health.
Monthly Recurring Revenue (MRR) & Annual Recurring Revenue (ARR): The Lifeblood of SaaS
MRR is the normalized monthly recurring revenue from all active subscriptions. It’s your steady income stream.
Formula:
MRR = (Number of active subscriptions * Average recurring revenue per subscription) + Expansion MRR – Churn MRR – Downgrade MRR
Example MRR Calculation:
If you have 5 customers paying $20/month and 10 customers paying $30/month, your MRR would be:
(5 customers x $20/month) + (10 customers x $30/month) = $100 + $300 = $400 MRR.
Remember to factor in new sales, upgrades (expansion), cancellations (churn), and downgrades. Gainsight provides excellent contextual examples for MRR calculations.
ARR is simply the annual equivalent of MRR, typically used for companies with annual or multi-year contracts.
Formula:
ARR = MRR x 12 (for annual contracts)
Customer Acquisition Cost (CAC): Understanding Your Investment in Growth
CAC measures the total cost of acquiring a new customer, encompassing all sales and marketing expenses.
Formula:
CAC = (Total Sales & Marketing Expenses) / Number of New Customers Acquired
Example CAC:
If you spend $100,000 on sales and marketing efforts in a quarter and acquire 100 new customers, your CAC is:
$100,000 / 100 customers = $1,000 CAC.
It’s vital to include all relevant expenses: salaries, tools, advertising, events, etc. Segmenting CAC by channel (e.g., paid ads, organic, referrals) can reveal where your investment is most efficient.
Customer Lifetime Value (CLV): Projecting Long-Term Customer Worth
CLV is the predicted revenue that a customer will generate throughout their relationship with your company. It’s a critical metric for understanding the long-term viability of your customer base.
Formula (Simplified):
CLV = (Average Revenue Per User (ARPU) * Gross Margin) / Customer Churn Rate
Example:
If your ARPU is $50/month, your gross margin is 80%, and your monthly customer churn rate is 2%, then:
CLV = ($50 * 0.80) / 0.02 = $40 / 0.02 = $2,000.
The LTV:CAC ratio (Customer Lifetime Value to Customer Acquisition Cost) is a key health indicator. A healthy ratio is typically 3:1 or higher, meaning a customer generates at least three times what it cost to acquire them.
Net Revenue Retention (NRR) & Churn Rate: The True Indicators of Health
These are arguably the most crucial SaaS KPIs for long-term health, especially for bootstrapped companies. They tell you how well you retain and grow revenue from your existing customer base.
Net Revenue Retention (NRR): Measures the percentage of recurring revenue retained from an existing cohort of customers over a specified period, including upgrades (expansion), downgrades, and churn.
Formula:
NRR = ([(Starting MRR + Expansion MRR) – Downgrade MRR – Churn MRR] / Starting MRR) x 100
Example NRR:
If your starting MRR was $100,000, you gained $10,000 from expansions, lost $5,000 from downgrades, and $1,000 from churn:
NRR = ([$100,000 + $10,000] – $5,000 – $1,000) / $100,000 x 100
NRR = ($110,000 – $6,000) / $100,000 x 100 = $104,000 / $100,000 x 100 = 104%.
According to SaaS Capital, the median NRR for bootstrapped SaaS companies with $3M to $20M in ARR is 104%, with top performers (90th percentile) reporting an NRR of 118%. This shows that even without new customers, top companies grow revenue from their existing base.
Churn Rate: This can be measured as Customer Churn Rate (percentage of customers lost) or Revenue Churn Rate (percentage of recurring revenue lost). Revenue churn is often more impactful as it accounts for the value of lost customers.
Revenue Churn Rate Formula:
Revenue Churn Rate = (Revenue Lost from Churn & Downgrades / Starting Recurring Revenue) x 100
Example Revenue Churn Rate:
If your recurring revenue drops from $10,000 to $9,000 in a month due to cancellations and downgrades:
Revenue Churn Rate = ($10,000 – $9,000) / $10,000 = $1,000 / $10,000 = 10%.
Other Critical Operational & Financial Metrics (e.g., ASP, Rule of 40)
Beyond the core four, other metrics offer crucial insights:
- Average Selling Price (ASP) / Average Revenue Per Customer (ARPC): The average revenue you generate per customer or per transaction.
Example ASP: If you have $200,000 in monthly revenue from 8,000 customers, your ASP/ARPC is $200,000 / 8,000 = $25/month. This helps gauge pricing strategy effectiveness. - The ‘Rule of 40’: A benchmark that suggests a healthy SaaS company’s combined revenue growth rate and EBITDA (or free cash flow) margin should equal or exceed 40%. It’s a quick measure of business health and efficiency, often used by investors to assess a company’s attractiveness. As Maxio and ChartMogul explain, companies can prioritize growth or profitability to meet the 40% threshold depending on their strategic stage, indicating favorable valuation multiples.
Best Practices for Data Accuracy and Avoiding Calculation Pitfalls
Precise calculations are only as good as the data they’re built upon. Here’s your checklist for ensuring SaaS data accuracy and preventing inaccurate KPI calculation:
- Consistent Definitions: Ensure everyone in your organization uses the same definitions for every metric. What constitutes a “new customer”? Is “revenue” recognized on booking, billing, or delivery?
- Centralized Data Source: Avoid disparate spreadsheets. Consolidate your data into a single source of truth.
- Automate, Automate, Automate: Manual data entry is the enemy of accuracy. Leverage software solutions that automate data collection and calculation. This directly addresses the pain point of effective SaaS metric calculation.
- Regular Audits: Periodically audit your KPI calculations. Spot-check raw data against calculated figures.
- Clean Data In, Clean Data Out: Implement data governance frameworks. Remove duplicates, correct errors, and ensure data integrity at the point of entry.
- Context is King: Numbers without context are meaningless. Always consider the business stage, market conditions, and strategic goals when interpreting metrics.
- Expert Review: Have financial controllers or data analysts review your methodologies. As Made To Measure KPIs notes, common KPI target problems often stem from flawed initial setup.
Precise metric calculation isn’t just about crunching numbers; it’s about building a foundation of undeniable truth for your business. Without this precision, every strategic decision, from pricing to marketing spend, rests on shaky ground, potentially leading to misallocated resources and missed growth opportunities.
Strategic Application: Leveraging Metrics to Drive Growth & Profitability
You’ve mastered the art of flawless calculation. Now, let’s talk strategy. This section shifts our focus from how to calculate to how to use your SaaS KPIs to drive tangible business outcomes. This is your “Strategic SaaS KPI Playbook,” addressing the pain point of prioritizing the most relevant KPIs and detailing how they inform every facet of your business.
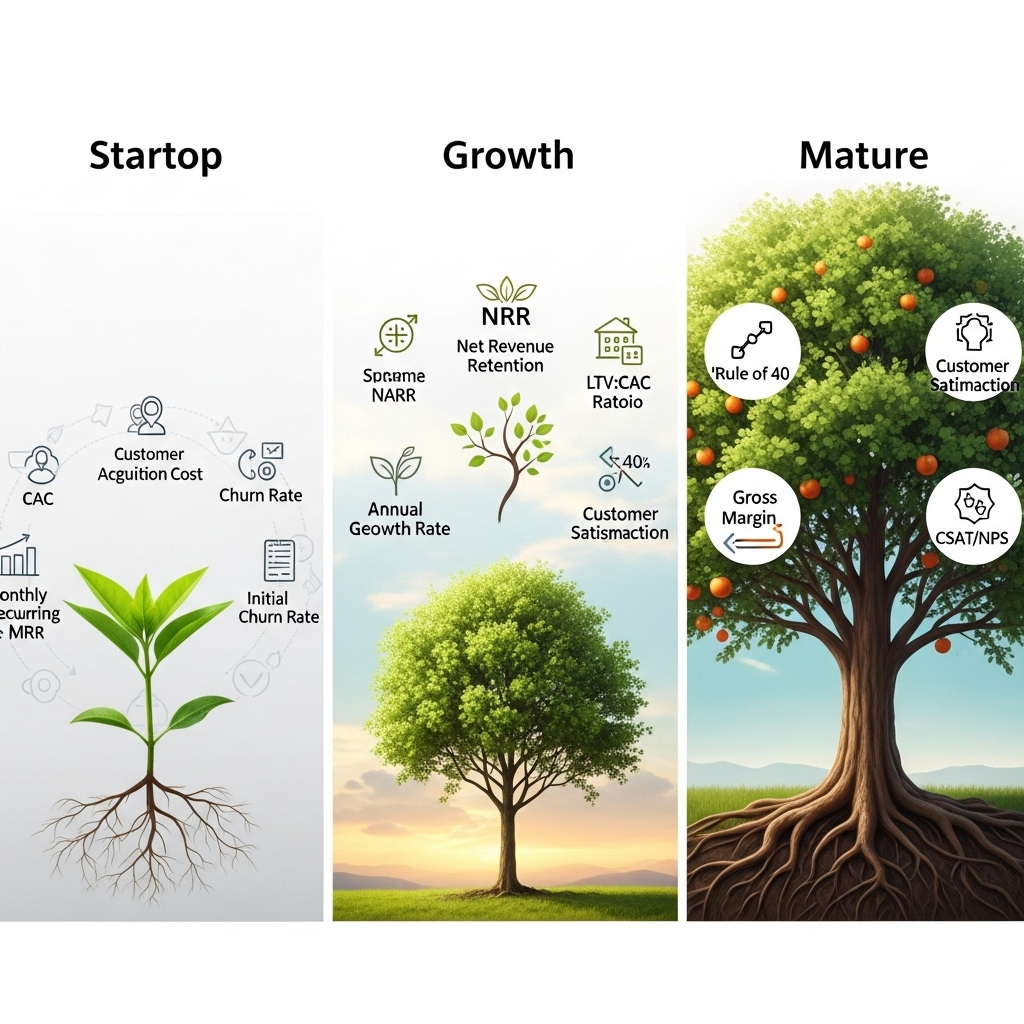
Choosing the Right KPIs for Your SaaS Stage (Startup, Growth, Mature)
Not all KPIs are equally important at every stage of your company’s journey. Prioritizing metrics based on your current strategic goals is paramount. NetSuite offers guidance on choosing the right KPIs based on growth phase, covering four main areas: revenue/growth, marketing, sales, and customer success.
- Startup Stage (Focus: Product-Market Fit & Initial Traction):
- Key KPIs: Customer Acquisition Cost (CAC), Customer Churn Rate, Monthly Recurring Revenue (MRR), Product Usage/Engagement Metrics (e.g., Daily Active Users – DAU, Feature Adoption).
- Why: You need to validate your product, find your initial paying customers, and understand if they stick around. High churn here is a red flag.
- Growth Stage (Focus: Scaling & Efficiency):
- Key KPIs: Net Revenue Retention (NRR), LTV:CAC Ratio, ARR/MRR Growth Rate, Sales Cycle Length, Customer Lifetime Value (CLV).
- Why: You’re scaling rapidly. The focus shifts to efficient growth, maximizing revenue from existing customers, and ensuring your acquisition costs are sustainable.
- Mature Stage (Focus: Profitability & Optimization):
- Key KPIs: Rule of 40, Gross Margin, Operating Expenses as % of Revenue, Customer Satisfaction (CSAT/NPS), Employee Retention.
- Why: Growth may slow, so efficiency, profitability, and maximizing the value of your existing base become critical.
Creating a “KPI selection matrix” based on company size, funding, and strategic goals can help you align your focus.
How Metrics Inform Marketing, Sales, and Product Strategy
Your KPIs aren’t just for board meetings; they’re the daily fuel for your operational teams. They directly influence and optimize strategies across departments, driving sustainable hyper-growth.
- Marketing: CAC helps you optimize ad spend and channel selection. Conversion Rates tell you which campaigns are effective. Website traffic and lead velocity rate reveal top-of-funnel health.
- Sales: Sales Cycle Length, Win Rate, and Average Selling Price (ASP) are crucial. By analyzing these, you can refine your sales process, improve forecasting, and identify bottlenecks.
- Product: Product usage metrics (DAU, MAU, feature adoption) inform roadmap decisions. NRR and Churn Rate directly reflect product stickiness and value.
- Customer Success: NRR, Churn Rate, Net Promoter Score (NPS), and Customer Satisfaction (CSAT) are their bread and butter. These metrics highlight areas for proactive engagement, support improvements, and upsell opportunities.
Understanding how different funding stages (bootstrapped vs. equity-backed) influence KPI targets and spending is also critical. For instance, bootstrapped companies often prioritize efficient growth and positive cash flow, whereas equity-backed companies might focus on aggressive growth rates, even if it means higher initial spend. SaaS Capital’s spending benchmarks show that median total spend for private B2B SaaS companies is 95% of ARR for bootstrapped companies, compared to 107% for equity-backed, highlighting different strategic priorities.
Optimizing for the ‘Rule of 40’ and Investor Relations
The ‘Rule of 40’ is a powerful benchmark for investors. It states that a SaaS company’s growth rate plus its profit margin (typically EBITDA or Free Cash Flow) should be 40% or higher. For example, a company growing at 30% with a 15% profit margin (45% total) is highly attractive. This metric suggests strong SaaS companies maintain revenue growth and profit margin rates above 40% for favorable valuation multiples.
When presenting SaaS investor metrics, clarity and context are paramount. Investors want to see a compelling narrative backed by data. Highlight your NRR, CAC payback period, LTV:CAC, and your adherence to or strategy for achieving the Rule of 40. Be transparent about your assumptions and future projections. Insights from SaaS founders, VCs, and CFOs consistently emphasize that a strong narrative, supported by accurate and strategically presented metrics, is key to securing funding and maintaining stakeholder confidence.
It’s also worth noting the nuances of vertical SaaS metrics. Companies like Fractal Software provide detailed guides on specific metrics relevant to niche vertical markets, which can differ significantly from horizontal SaaS.
Strategic application of metrics transforms raw data into a powerful compass, guiding your SaaS business through market shifts and competitive landscapes. Without this strategic lens, even perfectly calculated numbers remain mere statistics, incapable of unlocking the full potential for growth and sustained profitability.
Predictive Power: Transforming SaaS Analytics into Actionable Insights
Data is all around us. But raw data is just noise without SaaS analytics to make sense of it. This section delves into the actionable nature of SaaS analytics, moving beyond descriptive reporting to focus on “transforming data into intelligence” and anticipating future trends. This is where you unlock the predictive power of SaaS analytics.
Setting Up an Effective SaaS Analytics Strategy
Implementing a robust SaaS analytics strategy isn’t a one-off task; it’s a continuous journey. Here’s a roadmap:
- Define Objectives: What business questions do you want to answer? Are you trying to reduce churn, increase feature adoption, or optimize pricing? Your objectives dictate which metrics to track.
- Identify Key Metrics: Based on your objectives, select the most relevant metrics and KPIs.
- Choose Tools: Select the right analytics platforms that align with your data sources and reporting needs.
- Establish Data Collection: Ensure consistent, accurate, and automated data collection from all relevant touchpoints (product usage, CRM, billing system).
- Build Dashboards & Reports: Create clear, digestible dashboards that visualize your KPIs for different stakeholders.
- Analyze & Interpret: Regularly review your data, look for trends, anomalies, and correlations.
- Act & Optimize: Use insights to make informed decisions, test hypotheses, and iterate on your strategies.
- Review & Refine: Continuously assess the effectiveness of your analytics strategy and adjust as your business evolves.
As Auvik emphasizes, aligning your tracking with your overall business strategy is crucial for effective SaaS management.
Key SaaS Analytics Tools and Platforms
The market is flooded with best SaaS analytics tools. Choosing the right ones depends on your specific needs:
- Product Analytics: Tools like Mixpanel, Amplitude, or Pendo help track user behavior within your application, identify popular features, and pinpoint friction points.
- Financial Analytics: Platforms like ChartMogul, Baremetrics, or Maxio integrate with your billing system to provide real-time MRR, NRR, churn, and other financial KPIs.
- CRM & Sales Analytics: Salesforce, HubSpot, or Zoho CRM offer insights into your sales pipeline, conversion rates, and sales team performance.
- Marketing Analytics: Google Analytics, HubSpot, or dedicated attribution platforms track website traffic, lead generation, and campaign effectiveness.
- All-in-One/Embedded Analytics: Solutions like Qrvey focus on transforming complex data into actionable insights and can provide embedded analytics for your own product. Younium also offers insights into SaaS analytics and reporting tools, highlighting their ability to segment revenue and track visitor behavior.
The key is to integrate these tools for a unified view of performance, avoiding data silos and ensuring consistency in your reporting.
Using Analytics to Anticipate Churn and Identify Growth Opportunities
This is where analytics truly shines: its ability to forecast and proactively address issues. By leveraging predictive churn analytics, you can identify at-risk customers before they leave.

- Identify Inactive Users: Track product usage metrics. A sudden drop in logins or feature engagement is a strong churn signal.
- Monitor Support Interactions: High support ticket volumes or negative sentiment can indicate dissatisfaction.
- Analyze Feature Adoption: Are customers using the core features that drive value? If not, they might not be getting enough value to stick around.
- Segment Your Data: Analyze churn patterns by customer segment, pricing tier, or acquisition channel. This reveals which groups are most vulnerable and why.
Similarly, analytics can uncover hidden SaaS growth opportunities:
- Upsell/Cross-sell Potential: Identify customers who are heavily using certain features or have reached usage limits, indicating readiness for an upgrade.
- Feature Optimization: Data on feature usage can inform product development, helping you build what customers truly need.
- Pricing Optimization: A/B test pricing models based on usage data or customer segments to maximize ARPU.
- New Market Identification: Analyze demographic or behavioral data to spot underserved niches or new customer profiles.
Testimonials and case studies from SaaS companies consistently show that those who successfully leverage analytics for growth can significantly reduce churn and unlock new revenue streams.
Leveraging predictive analytics transforms your SaaS business from reactive to proactive, allowing you to anticipate challenges like churn before they escalate and seize growth opportunities before competitors even see them. This forward-looking approach is the hallmark of truly data-driven success, turning raw data into your most powerful strategic asset.
Competitive Edge: Mastering SaaS Performance Benchmarking
You’ve got your internal house in order. Now, how do you stack up against the competition? SaaS performance benchmarking isn’t just about comparison; it’s about gaining a competitive edge. This section provides actionable insights on how to conduct benchmarking, identify relevant industry segments, and interpret results to drive strategic decisions.
Why Benchmarking is Crucial for SaaS Companies
Operating in a vacuum is a recipe for stagnation. Benchmarking provides external context for your internal metrics. It helps you:
- Identify Areas for Improvement: If your churn rate is significantly higher than the industry median, you know where to focus your efforts.
- Set Realistic Goals: Benchmarks provide data-driven targets, making your goals achievable yet ambitious.
- Understand Market Position: Are you a top performer, an average player, or lagging behind? Benchmarking reveals your standing.
- Validate Strategies: If your NRR is above average, it validates your customer success and expansion strategies.
- Attract Investors: Demonstrating that your KPIs meet or exceed industry benchmarks is a powerful signal to potential investors.
As MadX.Digital explains, benchmarking is fundamental to understanding your strategic value. Indeed, the 2025 B2B SaaS performance benchmarking report by Baker Tilly is highlighted as a “crucial tool for comparing your company’s performance against peers” and uncovering opportunities for sustained growth.
Finding and Interpreting Reliable Industry Benchmarks
The quality of your benchmarks is as important as the quality of your own data. Seek out reputable sources:
- Industry Reports: Organizations like SaaS Capital, Maxio, and Baker Tilly publish annual benchmark reports based on extensive surveys of SaaS companies. These are invaluable resources.
- For instance, SaaS Capital’s data shows that the median growth rate for bootstrapped SaaS companies with $3M to $20M in ARR is 20%, with the 90th percentile reaching 51%. This gives you a clear target for growth.
- Maxio’s 2025 report notes that “2024 was a pivotal year for B2B SaaS companies, shifting from ‘growth at any cost’ to efficient revenue growth,” emphasizing the changing landscape and what metrics are now prioritized.
- Data Aggregators: Platforms like Databox collect anonymized data from thousands of companies, offering benchmarks for various metrics. For example, Databox’s research (from ~300 companies) found that the median value for unique monthly visitors for SaaS companies was 3.03K a month.
- Consulting Firms & VCs: Many firms specializing in SaaS provide proprietary benchmark data.
Interpreting Benchmarks Accurately:
- Contextualize: Don’t compare apples to oranges. Look for benchmarks that match your company’s:
- Size: Revenue band (e.g., $1M-$5M ARR, $5M-$20M ARR).
- Funding Stage: Bootstrapped vs. equity-backed.
- Industry Niche: Vertical SaaS often has different dynamics than horizontal SaaS.
- Business Model: Self-serve vs. enterprise sales, freemium vs. paid.
- Look at Medians and Percentiles: The median gives you the middle ground. The 75th or 90th percentile shows you what top performers are achieving.
- Trend Over Time: How are the benchmarks evolving? Are churn rates increasing across the board, or is it just your company?
A Framework for Strategic Benchmarking and Improvement
Here’s a step-by-step guide for performing a self-assessment benchmark and formulating improvement plans:
- Select Your Core KPIs: Choose 3-5 critical KPIs to benchmark (e.g., NRR, CAC, CLV, Growth Rate).
- Identify Relevant Peers: Use the criteria above (size, funding, industry) to find the most comparable benchmark data.
- Collect Your Data: Ensure your internal calculations are flawless (refer to Section 2).
- Compare & Analyze Deviations: Plot your performance against the median and top percentiles. Where are you significantly underperforming or outperforming?
- Root Cause Analysis: For underperforming metrics, dig deep. Why is your churn higher? Is it product, support, or pricing?
- Formulate Action Plans: Develop specific, measurable strategies to address the identified gaps. For example, if your CAC is too high, perhaps you need to optimize your ad spend or explore new channels.
- Monitor & Iterate: Benchmarking is not a one-time event. Regularly review your performance against benchmarks and adjust your strategies.
Expert commentary consistently advises against simply chasing a number. Instead, interpret benchmark deviations as opportunities for strategic investment and optimization. This systematic approach fills the content gap of a clear methodology for identifying and selecting the most relevant peer groups for benchmarking.
Without consistent benchmarking, your SaaS company risks operating in a vacuum, unaware of industry shifts or where true competitive advantages lie. Strategic benchmarking transforms comparison into a powerful growth engine, revealing clear pathways to outperform peers and secure a leading position in the market.
Overcoming Common Challenges in SaaS Metric Management
Even with the best intentions, managing SaaS metrics can be fraught with challenges. From inaccurate KPI calculation to poor SaaS performance tracking, these pitfalls can derail your growth. This section directly addresses these problems, providing actionable solutions for ensuring data integrity, effective communication, and robust tracking.
Addressing Inaccurate KPI Calculations and Data Integrity Issues
The ghost in the machine for many SaaS companies is flawed data. The root causes of inaccurate calculations often stem from:
- Inconsistent Definitions: As discussed earlier, if “customer” means something different to sales than it does to finance, your numbers will never align.
- Manual Data Entry & Spreadsheets: Prone to human error, version control issues, and lack of real-time updates.
- Data Silos: Information scattered across different systems (CRM, billing, product analytics) without proper integration.
- Lack of Data Governance: No clear rules or processes for how data is collected, stored, and used.
Solutions for Data Quality & Accuracy:
- Standardize Definitions: Create a central glossary of all metrics and KPIs, with clear, unambiguous definitions accessible to all teams.
- Automate Data Pipelines: Invest in software solutions that integrate your various systems (CRM, billing, product analytics) to automatically pull and aggregate data. This is key for effective SaaS metric calculation.
- Implement Data Validation: Set up checks and balances within your systems to flag incorrect or incomplete data at the point of entry.
- Regular Audits & Reconciliation: Periodically audit your KPI calculations against raw data sources. Reconcile discrepancies between different metric reporting systems.
- Invest in a Single Source of Truth: Consider a dedicated financial or analytics platform that centralizes all your key data.
Revolutionizing Poor Performance Tracking Systems
Symptoms of poor SaaS performance tracking are often evident: lack of clear user engagement metrics, outdated dashboards, or an inability to answer basic questions about business health. This can lead to significant strategic blind spots. For instance, CBS Insights research via BrosCorp.net suggests common SaaS startup failure reasons include “absent market need (42%)” and “poorly executed marketing (13%)” – issues that robust tracking could reveal early.
Strategies for Robust Tracking:
- Define Your Tracking Needs: What specific questions do you need answered? This forms the basis of your “SaaS Performance Tracking Audit” checklist.
- Implement Comprehensive Event Tracking: For product performance, track every meaningful user action (logins, feature clicks, session duration, etc.).
- Integrate Your Tools: Connect your billing, CRM, product, and marketing analytics tools. Younium and Auvik highlight the power of integrated SaaS management and reporting tools for a unified view of performance.
- Build Actionable Dashboards: Design dashboards that are not just visually appealing but provide actionable insights at a glance.
- Set Up Alerts & Automated Reporting: Configure alerts for critical deviations (e.g., sudden churn spike, drop in conversion rate). Automate weekly or monthly KPI reports for relevant stakeholders.
- Train Your Team: The human element is crucial. Ensure your teams understand the metrics, how they’re calculated, and how their work impacts them.
Communicating Complex Metrics to Stakeholders
You’ve done the hard work of calculating and analyzing. Now, how do you present it simply and effectively to non-financial stakeholders—your sales team, product managers, or even your board and investors?
- Know Your Audience: Tailor your presentation. A sales leader needs to know how CAC impacts their targets, not the intricacies of ASC 606.
- Focus on the “So What?”: Don’t just present numbers. Explain what the numbers mean for the business and what actions they imply.
- Use Visuals: Charts, graphs, and simple infographics can convey complex information far more effectively than tables of numbers.
- Tell a Story: Frame your metrics within a narrative. “Our NRR increased because of X product improvement, leading to Y impact on profitability.”
- Provide Context & Benchmarks: Always show your performance relative to your goals and industry benchmarks.
- Keep it High-Level, with Drill-Down Capability: Start with the most important KPIs. Be prepared to drill down into the underlying data if questions arise.
Ignoring the common pitfalls in SaaS metric management is akin to building a skyscraper on quicksand, where every decision is undermined by faulty data and miscommunication. By proactively addressing these challenges, you transform your data from a source of confusion into a crystal-clear, unified source of truth, empowering every team member to contribute to measurable success.
This guide provides general information and is not financial or legal advice. SaaS metrics and KPIs should be interpreted in the context of your specific business model, industry, and strategic goals. Consult with financial professionals for tailored advice.
Conclusion
You’ve journeyed through the intricate world of SaaS metrics and SaaS KPIs, from foundational definitions and flawless calculation to strategic application, predictive analytics, and competitive benchmarking. You now possess the knowledge to transform confusing numbers into a powerful engine for growth, profitability, and competitive advantage.
Remember, mastering SaaS metrics isn’t a destination; it’s a continuous process of learning, refining, and adapting. It’s about building a data-driven culture where every decision is informed, every strategy is validated, and every opportunity is seized. This Definitive Playbook has equipped you with the tools and frameworks to not just track your business, but to truly understand its pulse, anticipate its future, and steer it towards unparalleled success.
Ready to transform your SaaS metrics from confusing numbers into a powerful engine for growth? Contact us today for a personalized consultation on optimizing your KPI strategy and unlocking your company’s full potential.
Frequently Asked Questions
What are the most essential SaaS metrics for business growth?The most essential SaaS metrics for business growth include Monthly Recurring Revenue (MRR), Annual Recurring Revenue (ARR), Customer Acquisition Cost (CAC), Customer Lifetime Value (CLV), Net Revenue Retention (NRR), and Churn Rate (both customer and revenue churn). These provide a holistic view of financial health, customer acquisition efficiency, and retention effectiveness.
How do you calculate key SaaS metrics like CAC, MRR, and CLV?CAC is calculated by dividing total sales and marketing expenses by the number of new customers acquired over a period. MRR is the sum of all recurring revenue from active subscriptions in a month. CLV is typically calculated as (Average Revenue Per User * Gross Margin) / Customer Churn Rate. Precise formulas and examples are crucial for accurate calculation.
What are typical benchmarks for SaaS metrics in bootstrapped companies?According to SaaS Capital, the median growth rate for bootstrapped SaaS companies with $3M to $20M in ARR is 20%, with top performers reaching 51%. Median Net Revenue Retention (NRR) is 104%, with the 90th percentile at 118%. Benchmarks vary by industry, company size, and funding stage, so it’s important to find relevant comparisons.
What is the difference between bookings, billings, and revenue in SaaS?Bookings represent a customer’s contractual commitment to spend money (e.g., signing a 12-month contract). Billings are the actual invoices sent to customers for services, which may be upfront, monthly, or quarterly. Revenue is recognized over the period the service is delivered, typically monthly, according to accounting standards like ASC 606, regardless of when it was billed or booked.
How can SaaS analytics help reduce customer churn?SaaS analytics helps reduce churn by identifying patterns in user behavior that precede churn (e.g., declining product usage, feature abandonment). By tracking engagement metrics, support interactions, and customer feedback, companies can proactively intervene with at-risk customers, optimize product features, and improve customer success strategies to enhance retention.
What is the ‘Rule of 40’ in SaaS, and how is it applied?The ‘Rule of 40’ is a benchmark suggesting that a healthy SaaS company’s combined revenue growth rate and EBITDA (or free cash flow) margin should equal or exceed 40%. It’s applied as a quick measure of business health and efficiency, often used by investors to assess a company’s attractiveness. Companies can prioritize growth or profitability to meet the 40% threshold depending on their strategic stage.
References
- Auvik. (n.d.). SaaS Optimization Tips: How to Get More From Your Software Investments. Retrieved from https://www.auvik.com/franklyit/blog/saas-optimization-tips/
- Baker Tilly. (2025). 2025 B2B SaaS benchmark report and interactive display. Retrieved from https://www.bakertilly.com/insights/b2b-saas-benchmark-report
- BrosCorp.net. (n.d.). Why SaaS Startups Fail and How to Prevent It. Retrieved from https://broscorp.net/why-saas-startups-fail-and-how-to-prevent-it/
- ChartMogul. (n.d.). SaaS Metrics Cheat Sheet. Retrieved from https://chartmogul.com/resources/saas-metrics-cheat-sheet/
- Databox. (n.d.). Metrics Every SaaS Company Should Track. Retrieved from https://databox.com/metrics-every-saas-company-should-track
- For Entrepreneurs. (n.d.). SaaS Metrics 2.0 – A Guide to Measuring and Improving Your SaaS Business. Retrieved from https://www.forentrepreneurs.com/saas-metrics-2-definitions-2/
- Fractal Software. (n.d.). A Guide to Vertical SaaS Metrics. Retrieved from https://www.fractalsoftware.com/perspectives/guide-to-vertical-saas-metrics
- Gainsight. (n.d.). Essential Guide: Product Management Metrics. Retrieved from https://www.gainsight.com/essential-guide/product-management-metrics/enterprise-product-metrics/
- Growth Equity Interview Guide. (n.d.). SaaS Metrics. Retrieved from https://growthequityinterviewguide.com/growth-equity/saas-metrics
- Investopedia. (n.d.). Key Performance Indicator (KPI): What it is, How it Works, and Examples. Retrieved from https://www.investopedia.com/terms/k/kpi.asp
- MadX.Digital. (n.d.). SaaS Benchmarks: How to Measure and Improve Your Performance. Retrieved from https://www.madx.digital/learn/saas-benchmarks
- Made To Measure KPIs. (n.d.). 10 KPI Target Problems That Kill Performance. Retrieved from https://madetomeasurekpis.com/10-kpi-target-problems-that-kill-performance/
- Maxio. (n.d.). SaaS Metrics: What Are They And Why Are They Important?. Retrieved from https://www.maxio.com/blog/saas-metrics
- Maxio. (2025). 2025 B2B SaaS Benchmarks Report. Retrieved from https://www.maxio.com/resources/2025-saas-benchmarks-report
- NetSuite. (n.d.). SaaS Metrics: A Comprehensive Guide. Retrieved from https://www.netsuite.com/portal/resource/articles/erp/saas-metrics.shtml
- NetSuite. (n.d.). SaaS KPIs: Key Performance Indicators for SaaS Businesses. Retrieved from https://www.netsuite.com/portal/resource/articles/erp/saas-kpis.shtml
- Plecto. (n.d.). 10 SaaS KPIs You Should Focus On. Retrieved from https://www.plecto.com/blog/sales-performance/10-saas-kpis-you-should-focus/
- Qrvey. (n.d.). What is SaaS Analytics?. Retrieved from https://qrvey.com/blog/what-is-saas-analytics/
- SaaS Capital. (n.d.). Benchmarking Metrics for Bootstrapped SaaS Companies. Retrieved from https://www.saas-capital.com/blog-posts/benchmarking-metrics-for-bootstrapped-saas-companies/
- SaaS Capital. (n.d.). Spending Benchmarks for Private B2B SaaS Companies. Retrieved from https://www.saas-capital.com/blog-posts/spending-benchmarks-for-private-b2b-saas-companies/
- Spider Strategies. (n.d.). Measures, Metrics, and KPIs: What’s the Difference?. Retrieved from https://www.spiderstrategies.com/blog/kpi-metric-measure/
- Stripe. (n.d.). Essential SaaS metrics. Retrieved from https://stripe.com/resources/more/essential-saas-metrics
- Younium. (n.d.). What is SaaS Analytics?. Retrieved from https://www.younium.com/blog/what-is-saas-analytics
- Younium. (n.d.). SaaS Reporting Tools: Your Guide to Smarter Business Decisions. Retrieved from https://www.younium.com/blog/saas-reporting-tools/


